Extending mcGDB
mcGDB was designed to be easily extended to support new environments and programming models. To estimate the quantity of work required to implement a new model or environment support, you should try to estimate how hard it would be to port the application in this model to one already supported by mcGDB:
- Components and dataflow models are relatively close, so that would be fairly easy to get a basic dataflow support.
- Components/dataflow are quite remote from GPU computing, so barely anything would be shared.
- OpenCL and Cuda are very close (same programming model behind, so not need to change algorythms at all---see our work with Specfem3D), so adding support is very quick (it took me one day of work)
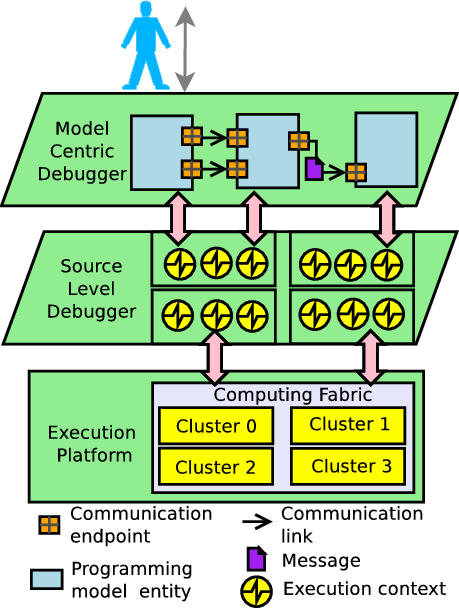
Model-Centric Debugging Architecture for an MPSoC Platform
In the PhD thesis dissertation, we divided mcGDB implementation into three axis. The Python code structure follows these axis, and we advise to follow this organization for the development of new modules:
- capture. The debugger needs to capture the information required to follow the evolution of the abstract machine state. In the figure, this corresponds to the pink arrows connecting the upper layer, the source-level debugger and the execution platform
- representation. The debugger needs to define internal structures reflecting the abstract machine organization, and update them according to the evolution of the machine state. These structures are depicted in the schema with the three interconnected entities
- interaction. The debugger must provide a high-level user-interface, allowing developers to efficiently interact with the abstract machine. Most of commands provided through this interface are parameterized by the current state of the internal representation. This interface is represented by the user on top of the diagram.
We use a few additional submodules for the need of the implementation and organization:
- toolbox. All the helper tools used for the implementation of the debugging support a given model/environment.
- user. Support code for handling Python-extensions provided by the debugger users.
- model, submodel or environment. Modules implementing submodels or supportive environment support.
Supporting a New Programming Model and its Environment
To add support for a new programming model and its environment, you need to proceed this way:
- Pick up a parent model: if you're model relies on tasks or components or dataflow, or on kernel computing kernels, you can reuse and extend our model support. Otherwise, you'll have to start from scratch. You can still inspire your code from what exists! Create a sub-directory in model, submodel or environment
- Build your representation: implement or specialize classes for the different entities of you model.
- Capture the environment event related to your representation. That usually means setting a FunctionBreakpoint on an API function and reading the function arguments (input parameters FunctionBreakpoint.prepare_before, but also updated and output ones, in FunctionBreakpoint.prepare_after). In the representation, define a simple API to the capture module should use to update the internal state, according to the execution events.
- Build the interaction module in the same spirit as the existing modules. Use class decorators Numbered, Listed Dicted frpm mcgdb.toolbox.python_utils to facilitate the listing and identification of the different entities.
Loading a Programming-Model Support
In order not to slow down mcGDB loading, and not to clog gdb command-line interface, we implemented different mechanism to load just in time the programming model debugging supports:
Loading models by name
From .gdbinit:
import mcgdb
mcgdb.initialize_by_name() # from the binary filenname $0
# or
mcgdb.load_by_name(name)
or through the command-line:
mcgdb load_model_by_name <name>
these commands enable the model(s) registered with the give name. Argument <name> can be compound by dashes, for instance in mcgdb-omp or mcgdb-omp-gomp. Name omp was registered with the following code:
mcgdb.register_model("OpenMP", "omp", ...)
Loading models by object-file filenames
Environment supports can also be enabled when a specific object file is loaded in the process memory:
mcgdb.register_model("GCC OpenMP", "libgomp.so", ...) mcgdb.register_model("Intel OpenMP", "libomp.so", ...) mcgdb.register_model("OMPSS OpenMP", "libnanox-c.so.1", ...)
Common use-case
The preferred solution is a combination of both mechanisms:
With mcgdb.initialize_by_name(), the binary name gdb, mcGDB does not initialize itself. with binary name mcgdb, mcGDB is loaded without model supports; and binary name mcgdb-omp, the OpenMP environment is loaded, but not the implementation specific parts.
Second, with the object-file loading, the runtime implementation specific capture module are enabled, and the relevant breakpoints are inserted.
mcGDB Extension Development Methodology
- Write a small demo application that contains all the main capabilities of your programming environment.
- Create a package for programming model/supportive environment
model-centric debugging code, and import it from where-ever you
want:
- if it's inside mcgdb package, put the import state in the parent package,
- if it's outside, put the import statement in a .gdbinit file.
- Because of module (circle) dependencies and side effects, in mcgdb we do not write any code in the scope of a module. Module initialization should be done in a initialize function, that will be automatically triggered by the framework after the Python import of all the modules:
def preInitialize(): # called *before* initializing submodules
  pass

def postInitialize(): # called *after* submodules initialization
  pass

def initialize(): # before or after not guaranteed
                  # (implementation dependent, currently
                  # equivalent to preInitialize)
  pass
Implement the capture module.
- Identify the functions that will change the state of the abstract machine (certainly those called by #1)
- For all of these functions, write a function breakpoint that catches the relevant parameters:
# Supportive environment function to capture:
# creation of a new task/thread
# > task_id = new_task(fct_ptr, name);

import mcgdb
from mcgdb.toolbox.target import my_archi
from mcgdb.toolbox import my_gdb

class new_task_Breakpoint(mcgdb.capture.FunctionBreakpoint)
  func_type = mcgdb.capture.FunctionTypes.conf_func

  def __init__(self):
    pass

  def prepare_before (self):
    data = {}
    data["fct_ptr"] = my_archi.first_arg()
    data["name"] = str(my_archi.third_arg(my_archi.CHAR_P).string())
    print("NEW TASK event: {}".format(data))

   return (False, True, data) # (dont't stop now, stop for after, data for after)

 def prepare_after (self, data):
    data["task_id"] = my_archi.return_value(my_archi.VOID_P)
    print("NEW TASK finish event: {} created with id {}".format(
            data["name"], data["task_id"]))

    return False # don't stop execution
See also
- Module
mcgdb.toolbox.target.my_archi - Class
mcgdb.capture.FunctionTypes - Class
mcgdb.capture.FunctionBreakpoint - Class gdb.Value
- Function gdb.parse_and_eval
- Function gdb.execute
- This example is "static", it's a breakpoint on a symbol of the supportive environment. You may need more dynamic function breakpoints, for instance on the task function pointer:
class task_execution_Breakpoint(mcgdb.capture.FunctionBreakpoint):

  def __init__(self, fct_ptr):
    # fct_ptr is a gdb.Value of type `void *`.
    addr = "*"+str(fn).split(" ")[0]
    mcgdb.capture.FunctionBreakpoint.__init__(self, addr)

 def prepare_before (self): ...
 def prepare_after (self, data): ...

 # add something like `task_execution_Breakpoint(data["fct_ptr"])`
 # in new_task_Breakpoint.prepare_before/after
- (Static) breakpoint classes need to be instantiated before the execution of the application, so write them into an activate function:
def activate():
  new_task_Breakpoint()
- In the package initialization code, you need to register your model-centric debugging package: for that purpose:
# enable submodule `OpenMP` when shared-library `libgomp.so` is loaded
mcgdb.register_model("GCC OpenMP", "libgomp.so",
                     mcgdb.toggle_activate_submodules(__name__), objfile=True)

# enable submodule `OpenCL` if symbol `clCreateKernel` is found in the application
mcgdb.register_model("OpenCL", "clCreateKernel", mcgdb.toggle_activate_submodules(__name__))
See also
register_model()toggle_activate_submodules()
- Make sure that the print functions output all the information you want to capture.
Now you need to connect the information you capture module to the internal representation.
Implement the representation module.
- Build an object-oriented representation of your programming model:
class Task():
  def __init__(self, id, name):
    self.id = id
    self.name = name
    self.dependencies = []

  def depends_of(self, task): ...

  def start_execution(self): ...
  def finish_execution(self): ...
- Implement look-up mechanisms: for instance in
task_execution_Breakpoint.prepare_before, you'll need to know
which task is being executed, that is, what is the id of the
current task (maybe a this variable in the frame
above?). Class decorator
mcgdb.toolbox.python_utils.Dicted()may help in that purpose: it adds two methods to your classes:init_dict()andkey_to_value():
# in `Task.__init__`:
Task.init_dict(id, self)

# in `task_execution_Breakpoint.prepare_before`:
id = your_way_to_lookup_id()
current_task = Task.key_to_value(id)
See also
- Class decorator
mcgdb.toolbox.python_utils.Dicted()and its documentationdicted_example. - GDB frame inspection functions
- Bind capture and representation modules, for all the programming model operations.
# in `new_task_Breakpoint.prepare_after`:
Task(data["name"], data["task_id"])

# in `task_execution_Breakpoint.prepare_before`:
current_task.start_execution()

# in `task_execution_Breakpoint.prepare_after`:
current_task.finish_execution()
- Add print statements to the representation functions to make sure they work as expected.
And that's it for the invisible parts. Now we're going to actually implement the functionalities we want to offer to the debugger users.
Implement the interaction module.
- Implement listing functions: add @Listed (adds Class._list) and @Numbered (adds Class.numbers[Parent_Classes] and Class.number) decorators to the classes to be listed, and write a new GDB command:
class cmd_info_tasks (gdb.Command):
  def __init__ (self):
    gdb.Command.__init__ (self, "info tasks", gdb.COMMAND_OBSCURE)

  def invoke (self, args, from_tty):
    # parse args to select what to display

    for task in representation.Task.list_:
      number = task.number
      print ("Task #{}: {} ({})".format(task.number, task.name, task.fct))
See also
- Class gdb.Command
- Class decorator
mcgdb.toolbox.python_utils.Listed()(listed_example) - Class decorator
mcgdb.toolbox.python_utils.Numbered()(numbered_example) - Function
gdb.string_to_argv()(documentation ?)
Implement new catchpoint functionalities:
- During initialization (function enable), register a new catchpoint:
mcgdb.toolbox.catchable.register("task-start")
- Inside a gdb.Command`(e.g.: `(gdb) task 5 catch start), set it for a particular object:
mcgdb.toolbox.catchable.activate("task-start", task)
- Inside representation objects (e.g.: Task.start_execution), check if we need to stop at this event:
if mcgdb.toolbox.catchable.is_set("task-start", task): ...
- If you need to stop the execution, and if you're in a FunctionBreakpoint, you can request an execution stop. This request will be checked before continuing the execution, after FunctionBreakpoint.prepare_before/after:
mcgdb.interaction.push_stop_request("we *had* to stop.")
See also
- Class
mcgdb.toolbox.Catchable - Attribute
mcgdb.toolbox.catchable - Functions
mcgdb.interaction.push_stop_request(),push_stop_requests() - Proceed stop request implementation:
mcgdb.capture.FunctionBreakpoint.stop()
Implement new graph visualization:
We can distinguish two kind of graphs that can be drawn, architecture and activity graph, whose development will be quite distinct.
Architecture graphs
Architecture graphs is just another form of listing, so the implementation will be similar to .
It refers to the section itself, see Implement Listing Functions.
See also
- Class decorator
mcgdb.toolbox.python_utils.Listed()(listed_example) - Graphviz and DOT language
Activity graphs
Drawing activity graphs is a bit more complicated and requires some engineering work.
- One way is to emits
Eventin the representation objects, as we did for GPU programming models:mcgdb.model.gpu.representation. - Another way is to intercept all the representation method
invocations and update the graph representation accordingly. We
implemented this method for OpenMP
mcgdb.model.task.environment.openmp.interaction.graph(this is an experimental implementation, copy-paste-adapt it if you want to reuse it):- add
mcgdb.model.task.environment.openmp.interaction.graph.Tracker()decorator to the classes (and subclasses) you want to track. e.g.:Worker,Job,Barrier - inside
do_tracking(), (after initialization), redefine your class structure and operate your graph construction. Method parameters are accessible through arg object, representation object is self and this is a storage location associated with self. Constructor parameters have to be save manually from fct_args:
- add
@Tracks(representation.ParallelJob)
class ParallelJobTracker:
    def __init__(this):
        args.num_workers, args.parent_worker = fct_args

        parent_thread = self_to_this[args.parent_worker].thread
        this.job = MultiTask(parent_thread, "par", "//")

    def start_working(this):
        entry_task = this.job.internal_task("entry_task")

        if this.first_start:
            this.job.parent.task.happened_before(entry_task)
            this.first_start = False

        thread = self_to_this[args.worker].thread
        thread.moveTo(entry_task, from_start=True)

    def stop_working(this):
        ...
See also
- Function
do_tracking() - Graph representation classes:
Thread,MultiTask,Task. - Representation interception classes:
mcgdb.model.task.environment.openmp.interaction.graph.do_tracking().WorkerTracker,ParallelJobTracker,BarrierTracker, ...
Low-Level Tracing
In order to trace all the information required to implement model-centric debugging, we implemented a transparent information tracing mechanism.
This tracing mechanism is based on a simple convention: the third
parameter returned by
mcgdb.capture.FunctionBreakpoint.prepare_before() contains
the parameters used for this FunctionBreakpoint. (This object is
also passed to
mcgdb.capture.FunctionBreakpoint.prepare_after() where it
can be updated). See Implement the capture module. for an example.
See also
mcgdb.toolbox.pajemethods for tracingbefore()andafter().mcgdb.toolbox.pajecommand for dumping the trace:paje_print- Implementation of capture before parameters
mcgdb.capture.FunctionBreakpoint.stop() - Implementation of capture after parameters
mcgdb.capture.FunctionFinishBreakpoint.stop()