mcGDB Module for OpenMP
As part as the first deliverable of the Nano2017 DEMA project, we extended mcGDB to support OpenMP debugging. This document presents the results of our work. It details the implementation choices we had to made, then introduces the new functionalities we designed for to enable model-centric debugging of OpenMP application. These functionalities are currently focused on the visualization of the current application state and the control of the step-by-step execution.
Implementation Challenges and Decisions
During the implementation of mcGDB support for OpenMP, we faces several difficulties regarding the best way to handle and control multiple threads of execution. Certain functions, such as barriers, involve multiple threads doing the same thing at the same time or at least in a particular order. Internally (i.e., inside the debugger) the application execution is sequentialized: each thread reports its events (to the OS in fact, by hitting a breakpoint and triggering a fault inside the OS), and the OS "posts" these events to the debugger. Besides, GDB's support for controlling the threads allowed to run is pretty limited: either only one thread runs (set scheduler-locking on), or they all run.
As a consequence, it is difficult to implement an operation like "stop all the threads right after this barrier function" just using breakpoints.
A Debugging Stub Preloaded in the Application
To cope with this limitation, we chose deport some of debugging code into the application address-space, through an OpenMP library stub dynamically preloaded between the application and the actual OpenMP implementation:
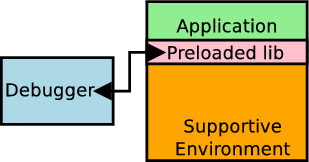
This preloaded library is specific to a given OpenMP ABI, in our case GNU GOMP. It exports the same symbols (all or part of) as the actual library, so that it can by bound to the application by the dynamic linker. The function stubs, when they are called by the application, can perform various debugging tasks. Then, with the help of the dynamic linked, they usually call the function "below", in the actual library implementation. If necessary, it can also alter the function parameters before passing then onward. Another piece of code can be executed after the library function returned.
Task of the Preloaded Debugging Stub
The main task of the debugging stub is to block some of threads from inside the application, instead of doing it through the debugger control of the scheduler. Here is a simplified example of how we do that:
volatile int mcgdb_can_pass_barrier = 1;

void
GOMP_barrier (void) {
    real_GOMP_barrier();

    while (!mcgdb_can_pass_barrier);
}
- When the application reaches an OpenMP barrier, and we want to stop the application right after this barrier (with the barrier open), mcGDB sets the variable mcgdb_can_pass_barrier to false.
- All the thread executions are continued.
- Each time a thread passes the barrier (i.e., returns from real_GOMP_barrier/the actual GOMP_barrier), a barrier counter inside mcGDB is increased, and the thread execution is released (but it will be blocked in the while loop).
- When the internal counter reaches "team" size, we know that all the threads are wait in our while loop.
- With all threads blocked, with open our while barrier, and for each individual thread, with GDB's scheduler-locking set, we finish the current function call (i.e., return to the calling function).
See also
Note
This preloaded library stub is specific to GOMP ABI. It is part of the capture package of mcGDB OpenMP support, which is also specific to GOMP ABI. Porting our OpenMP support to another OpenMP implementation would only involve rewriting this capture package.
Current-State Visualization
To help developers understanding the current state of OpenMP applications, we introduced a visualization engine based on UML sequence-diagram formalism.

In this figure, we can see the following information:
- There are four active workers (threads), Worker 4 is currently focused in gdb (highlighted in orange).
- The Workers are inside a critical zone, and Workers 1, 3 and 2 have passed the critical section (in this order). Worker 4 is currently inside the critical section.
Note
The "failed" arrow, "----X" indicates the current location of the worker.
This sequence-diagram representation is based on SeqDiag, although quite adapted to support non standard-compliant representations of OpenMP executions. Seqdiag uses a textual diagram description inspired by GraphViz DOT language:
{
  1; 2; 3; 4;

  1 -> 1 [leftnote="main"];
  parallel {
    2; 3; 4; 1;

    single {
      2; 3; 4; 1;

      1 -> 1 [label="enter"];
      1 <- 1 [label="exit"];
      === <Barrier 1> ===
    };
    critical {
      2; 3; 4; 1;

      1 -> 1 [label="enter"];
      1 -> 3;
      3 -> 2;
      2 -> 4;
      4 <- 4 [label="finish"]
} } }
We can recognize in this example the critical zone discussed above, inside a parallel zone. Before the critical zone, we can see a single zone, with its implicit barrier, that was executed by the first worker.
Note
All of these information are captured dynamicallyat runtime and refect the actual execution choices and artifacts.
McGDB now provides a (simple) graphical interface (GUI) that displays in realtime (in GDB's interactive mode only) the state of the application. The internal OpenMP representation is actually checked each time GDB's prompt is display, and redrawn if something changed.
(gdb) set opm-graph-auto on
OpenMP auto graph enabled
(gdb) gui start
Please run this command to connect the GUI:
python2 /home/kevin/travail/Python/mcgdb/toolbox/graphdisplay.py &
The interactivity of the GUI is currently rather limited, mainly for technical reasons: GDB is single-threaded, and hence not thread-safe. However to interact transparently with the GUI, a second thread would hav been required: one for GDB and the command-line interface and one (at least) to receive orders from the GUI and process them. As far as we have tested, this is not possible with current versions of GDB, and it will certainly never be. The solution we chose to allow some interactivity with the GUI is to manually (i.e., from the command-line) give the control to the GUI:
(gdb) gui control
Press ^C to release the control.
This (blocking) command waits for orders from the GUI, and execute them inside GDB's main thread of execution. This solution ensures that there will not be any race condition inside GDB or Python internal code.
Currently, only switching the current thread is possible. This is done by clicking the label of a worker.
Warning
Sometimes, starting the GUI before OpenMP has been initialized (first #pragma parallel) freezes GDB. The reason is still unclear, GDB is blocked in sigsuspend(2), waiting for a signal from the application that never comes. It is certainly due to the fact that the connection between GDB and the debuggee is pretty complex, and their one-to-one relation is disrupted by the presence of the GUI process. The current fix consist in letting the user start the GUI by his/herself. Command gui start --connect does it automatically, but the result is not guaranteed!
Information about the Current State
| info workers |
Lists all the workers (threads) active in the application.
- > denotes the worker currently active in GDB.
- > ... ! indicates that GDB's scheduler-locking is currently set.
- # ... (dead) indicates that the worker is dead.
We also detail the "job stack" of the workers, which indicates in which zones the worker is.
Note
We currently do not support nested loops. When we'll introduce this support, this function will detail the team memberships.
| info barrier |
If there is a barrier currently active, give details about it: * is it at internal barrier (e.g. created by a single construct) * is the barrier open (i.e., some workers already passed it) * which workers are currently blocked at this barrier?
| opm sequence [...] |
Plots the sequence diagram of the current state of the OpenMP application. By default, it saves the diagram description in a local file named run, and generates run.svg with the help of seqdiag. This default behavior can be changed with the following options:
--allPrint the entire diagram, not only the current state.--no-genDo not run seqdiag in the end.--printor--show. Do not generate the SVG file, and print the diagram description on screen. Implies--no-gen.--syncWait for seqdiag to complete before continuing.--asyncDo not wait for seqdiag to complete before continuing. This is the default behavior.--openRun Eye-of-Gnome (eog) on the generated SVG file. Implies--sync.--guiForce the refresh of the GUI (it must have been started with gui start). Implies--sync.
| set opm opm-auto-sequence on|off |
Activate or deactivate OpenMP automatic sequence diagram generation. If the GUI is started, this option is implicitely set.
The "automatic generation" is triggered when GDB prompt is about to be displayed. Three parameters currently determine if the diagram should be reconstructed:
- mcGDB internal OpenMP representation has changed (i.e., a function from the representation module has been called),
- the state of GDB scheduler-locking has changed,
- the current thread/worker has changed.
To force manually the refresh of the diagram, run opm sequence --gui --async.
Step-by-step Execution Control
So far, we mainly focused on helping the user to control the step-by-step execution of his/her application. In this section, We present these new functionalities. We start with general commands, then we details those specfic to a given OpenMP construct.
General Commands
| opm start [--force] |
This command continues the execution until the beginning of the first (or next) parallel zone.
When the command completes successfully, it switches to the first worker/thread.
Note
The command bails out if the first worker is already in a parallel
zone. Option --force disables this verification.
| opm next <target> |
Continues the execution until the next :target
zone. :Target can take file following value: single,
parallel, critical, task, sections, barrier, master.
Note
This command takes you to the earliest detection point of the zone. This is typically when the most advanced worker calls OpenMP internal function handling this zone. The following functions let you control how you enter the zone.
See also
Source file: mcgdb.model.task.environment.openmp.interaction.step
| opm step [out] |
This command steps the execution into the next OpenMP zone. Contrary to opm next, opm step stops the execution inside the zone.
- Option
outstops the execution when the current zone is considered finished. That is when all the threads are out of the zone, or phrased the other way around, when the last thread exited the zone.
Note
Command opm step out stops the execution when the last thread leaves the zone. There is no guarantee on where the other threads will be.
See also
Source file: step
| opm all_out |
Stronger version of opm step out relying on the preloaded library.
After opm all_out, all the workers have completed the zone and are stopped right after. The active worker is not changed after the command finishes (i.e., we enforce it).
Warning
Currently only works inside single zones, but it should be easy to extend to all the zones relying on OpenMP function calls.
#opm section
| opm sections new [off] |
Command opm sections new set a catchpoint on the beginning of OpenMP sections zones.

Warning
When this catchpoint is triggered, it stops the execution before the beginning of the first zone, that is, inside OpenMP code. See opm sections step-by-step to step inside the sections.
Option off disables the breakpoint.
| opm sections finish |
This command continues the execution until the end of the current section zone.
Note
This command bails out if the current worker is not inside an OpenMP sections zone.
| opm sections step-by-step |
This command activates the step-by-step execution of the current OpenMP multi-section zone. The thread scheduler is locked to the current thread, and a catchpoint will stop the execution at the beginning of each new section:
WARNING:root:Setting GDB scheduler-locking to 'on' for stepping between sections.
INFO:root:SectionJob #1 has 3 sections, 0 already completed.
Section zone breakpoint enabled on SectionJob #1.
(gdb) continue
[Starting execution of Section 1.]
(gdb) continue
[Starting execution of Section 2.]
(gdb) continue
[Starting execution of Section 3.]
(gdb) opm sequence # see below
(gdb) continue
WARNING:root:Zone stepping finished, disabling GDB scheduler-locking.
[SectionJob #1 finished.]
(gdb) ...

#opm critical
| opm critical next |
This command continues the execution until the next thread enters the OpenMP critical zone.
Note
This command bails out if the current worker is not inside an OpenMP critical zone.

#opm barrier
| opm barrier pass |
The command continues the execution until all the workers have passed the current barrier. After the completion of the command, all the workers will be waiting after the barrier.
Note
This command bails out if there is no active OpenMP barrier.
Warning
There is currently a bug in the visualization, highlighted in the figure below, that leads to incorrect positioning of the workers current location. Here, Workers 1 and 3 did not enter barrier yet. However, because the barrier zone is drawn before the arrow of these workers, they appear afterwards.
This is easy to fix for barrier, because we know that Workers 1 and 3 did not reach the barrier yet, and they have to. However, this can be trickier with other zones with weaker assumptions.

GUI Control
| gui start [--connect] [--host=<host>] [--port=<port>] [--authkey=<authkey>] |
Starts the GUI server. If option --connect is not passed,
the GUI client is not started. This is because of a bug in the current
implementation, as explained previously. Instead, it prints a command
that should be executed outside of GDB to bypass the bug:
python2 /home/kevin/travail/Python/mcgdb/toolbox/graphdisplay.py &
This command must be executed first, to enable the following ones.
Options --host, --port, --authkey allow
customizing the GUI connection point. They can and should be passed to
the GUI client.
See also
SyncManager and BaseManager for details about the remote connection.
So far it appears that it doesn't work between two computers ...
| gui show [off] |
Closing the GUI window doesn't kill it. This command shows it again.
Option off hides it.
| gui control |
Allow the GUI to react interactively. Hit control-C to quit the
command.
Option --show is for debugging purposes. It prints on-screen
the messages received from the GUI pipe.
| gui put <str...> |
Warning
This is a debugging command.
Puts the parameter string into the GUI communication pipe. The GUI expects to receive a javascript statement that will be executed by the Javascript engine without contraints (except keywords show hide and quit).
| gui quit |
Tells the GUI to disconnect iself then closes the communication channels.