Performance Evaluation of Breakpoint-Based Runtime-Information Capture
The charts present the time it takes to carry out various operations in GDB and mcGDB. The figures are in useconds, they represent the time taken by a single operation (named in the legend). The experiments were repeated 10 times, which corresponds to the (hidden) abscissas of the graphs.
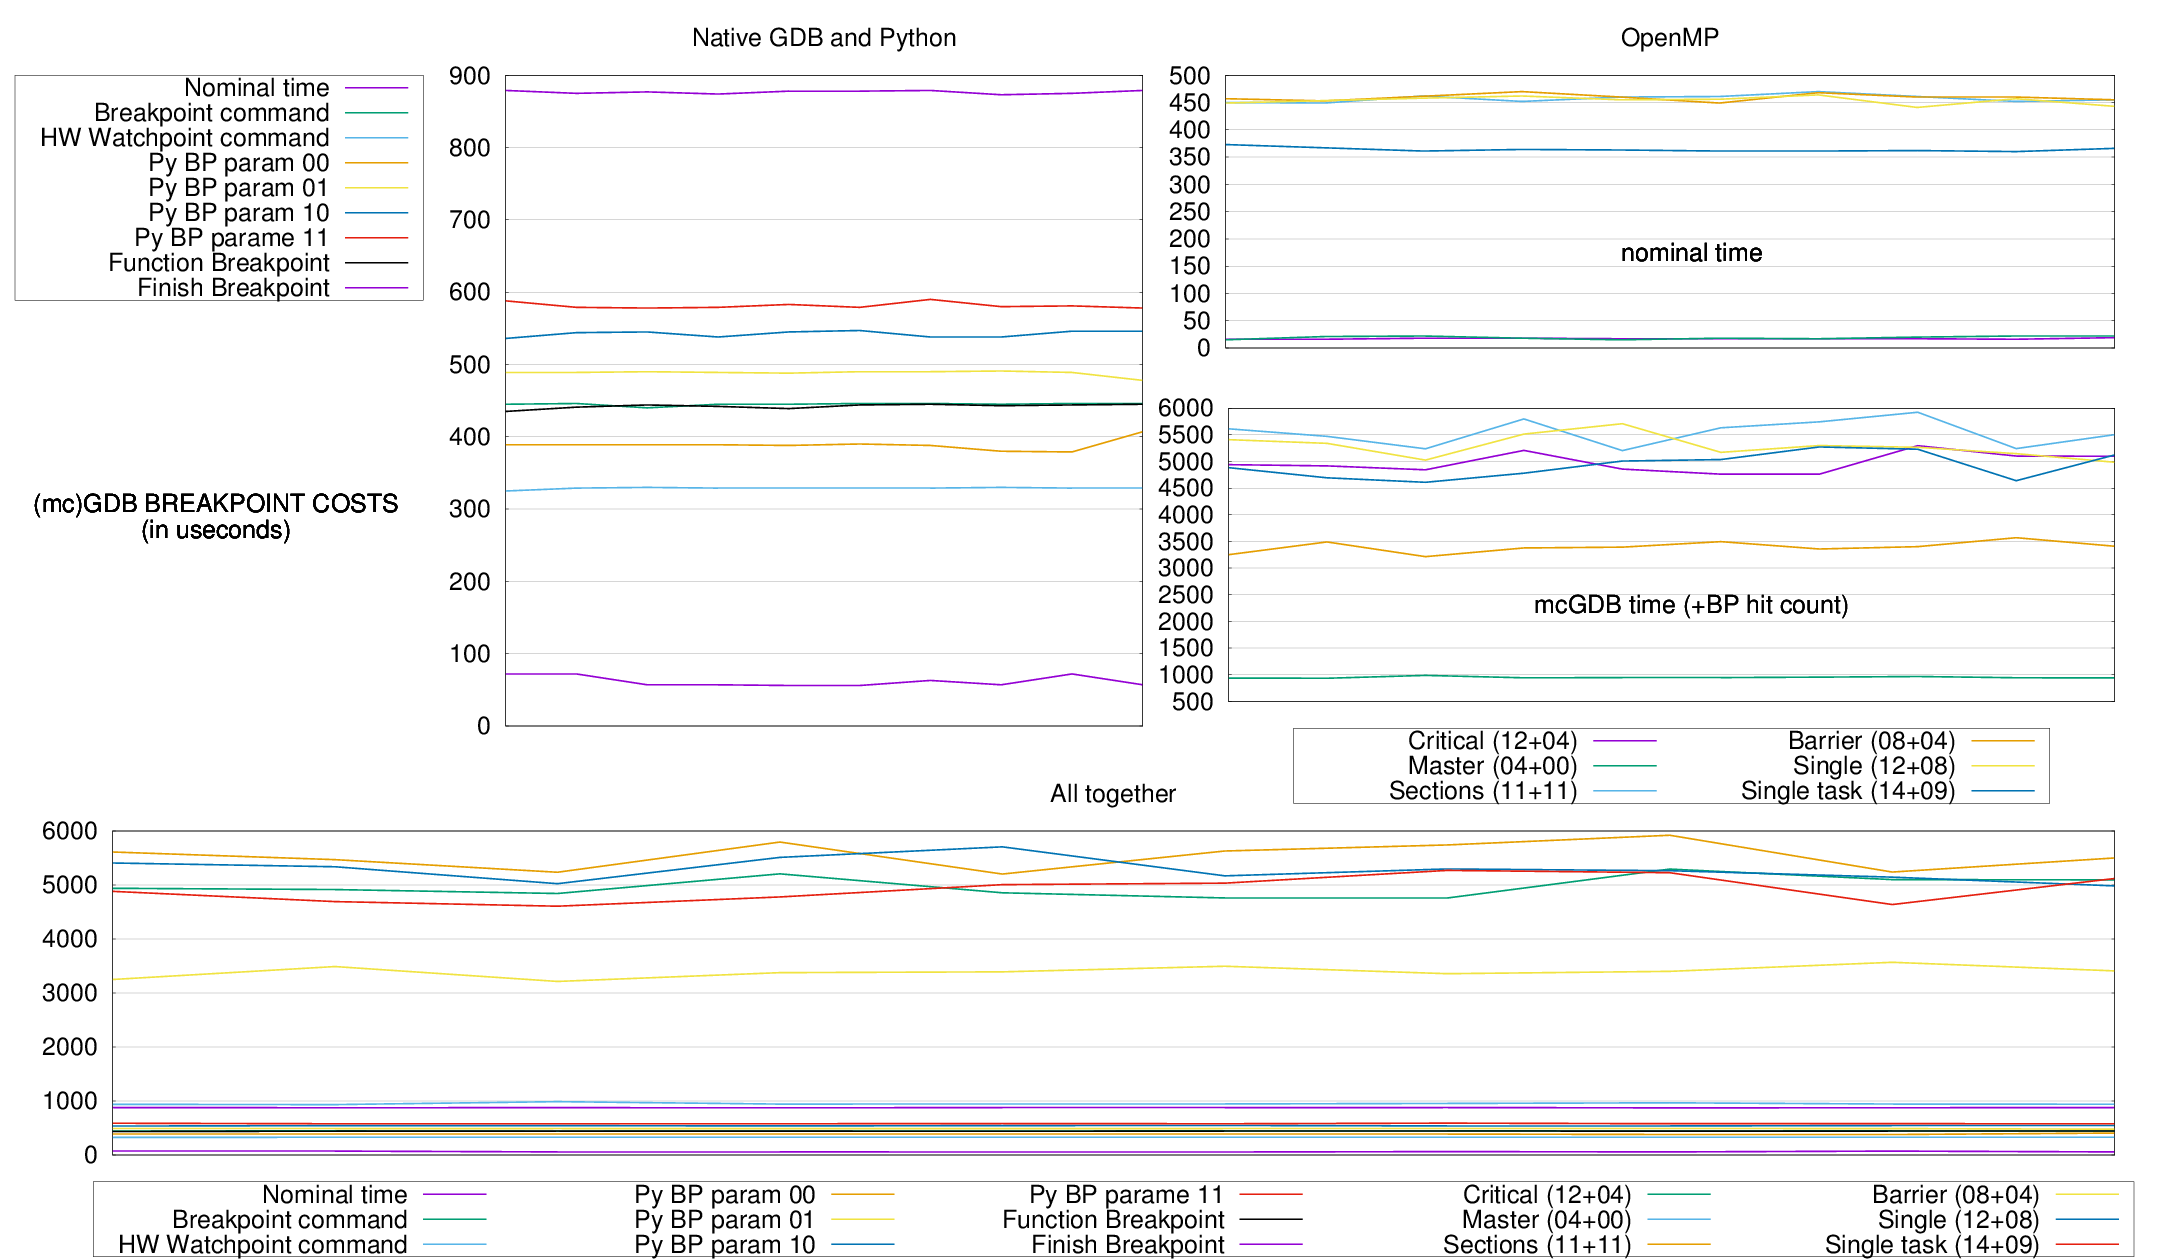
Native GDB And Python
This chart presents the time it takes to carry out some of GDB basic operations.
- Nominal time
- Time of the usleep(t) syscall, The sleep time t is always excluded.
- Breakpoint command
- Time of an internal GDB breakpoint with the historical implementation (break <loc>; command silent continue;.
- HW Watchpoint command
- Like above, but with an address (hardware) breakpoint.
- Python Breakpoint parameters ii
Internat breakpoint with a Python callback. The last digit indicate (as a binary flag) what parameters where read:
- is a function parameter: int(gdb.parse_and_eval("it")
- is a local variable of the caller function: int(gdb.newest_frame().older().read_var("i").
- Function Breakpoint
- This is a basic mcGDB breakpoint, with some more Python code involved that Python Breakpoint parameters 00.
- Finish Breakpoint
- This is another basic mcGDB breakpoint that stops before and after a function call.
From this chart, we can draw the following conclusion:
- Hardware watchpoints are faster than breakpoints. This makes sense as for breakpoints, GDB needs to switch to the debuggee context multiple times to single-step over the breakpointed instruction, whereas this is (certainly) automatic with watchpoints.
- Python breakpoints are faster than GDB commands. Maybe because of the late parsing?
- Reading values from the debuggee's current frame takes 100us. Reading it from the frame above adds 50us, which maybe the take required to query the OS about the stack registers value. 100us is also close to the difference of time between a breakpoint and a watchpoint.
- The FunctionBreakpoint takes as much time as GDB breakpoint command. The additional time compared with the simple python breakpoint (parameters 00) certainly comes from Python interpretation cost.
- The FinishBreakpoint involves 2 breakpoints, so it's logical that it takes twice as much time as the FunctionBreakpoint. (Note that this is not a gdb.FinishBreakpoint, which currently takes a lot of time, 120.000us, I'll have to investigate what happened.)
mcGDB OpenMP
This chart presents the time it takes to pass the different OpenMP constructs. The experimentation ran on a quad-core processor, so with 4 OpenMP threads/workers.
The sections zone has 3 sections.
The line single task stands for a task spawn from within a single construct.
The figure indicated in the legend is the number of breakpoints that where hit (before+after). We did not include in that count the 16+5 breakpoints required to handle the new threads and parallel zones.
From this chart, we can draw the following conclusion:
- The master construct is the fastest to pass, but also the simplest: the master threads (get_id() == 0) executes the block, the other continues.
- The barrier construct is also fast. There are 4 breakpoints that come from the preloaded library. They could have been disabled to improve the performance, as they are only useful in interactive mode. The 4+4 others correspond to the hit of the barrier function and its return.
- The construct critical and single (because of the barrier) also have these spurious stops in the current benchmark.
- I cannot explain why the single+task construct is faster than the single construct. Maybe a different handling inside OpenMP. The 3 additional breakpoint correspond to the task creation (1) and execution (1+1).